Meet Higher Impact
Need help choosing a solution?Ask an Expert

Market insights based on real-world activity

Most market data is months old. Ours isn't - buyer demand tracked live, the rest of the market refreshed monthly

3.0M

Demand and supply signals

460+

Solutions tracked

Live + monthly

Demand and market benchmarks

3.0M

Demand and supply signals

460+

Solutions tracked

Live + monthly

Demand and market benchmarks

Understand what buyers are looking for

See what buyers are searching for in real time, and which categories are heating up - so you spot trends while they're still forming.

KanataQ Market Intelligence Searches dashboard showing total searches (16,986), monthly search volume, high-intent search rate (48.5%), and a table of recent buyer search terms.
KanataQ Market Intelligence conversion-rate dashboard with a line chart comparing All Solutions versus a Carbon Accounting segment over time, alongside a metrics sidebar.

Compare categories and market activity

Review conversion rates, pricing, lead value, solution density, and engagement across the market. Compare individual categories with broader benchmarks to understand their relative position.

Make better-informed decisions

Whether you're buying, investing, advising, or positioning, back every decision with current market data instead of guesswork.

KanataQ Market Intelligence Profile Views dashboard with a line chart comparing average buyer views over time for All Solutions versus a Carbon Accounting segment, both trending upward.

Understand what buyers are looking for

See what buyers are searching for in real time, and which categories are heating up - so you spot trends while they're still forming.

KanataQ Market Intelligence Searches dashboard showing total searches (16,986), monthly search volume, high-intent search rate (48.5%), and a table of recent buyer search terms.
KanataQ Market Intelligence conversion-rate dashboard with a line chart comparing All Solutions versus a Carbon Accounting segment over time, alongside a metrics sidebar.

Compare categories and market activity

Review conversion rates, pricing, lead value, solution density, and engagement across the market. Compare individual categories with broader benchmarks to understand their relative position.

Make better-informed decisions

Whether you're buying, investing, advising, or positioning, back every decision with current market data instead of guesswork.

KanataQ Market Intelligence Profile Views dashboard with a line chart comparing average buyer views over time for All Solutions versus a Carbon Accounting segment, both trending upward.

From questions to market clarity

Talk to our team

Share the markets, categories, or decisions you are exploring.

Get Intelligence access

Explore the data and benchmarks most relevant to your work.

Track demand and market movements

Follow buyer interest in real time and compare the wider market monthly.

Act with confidence

Use current evidence to sharpen your strategy and move earlier.

KanataQ Market Intelligence Profile Views dashboard with a line chart comparing average buyer views over time for All Solutions versus a Carbon Accounting segment, both trending upward.
KanataQ Market Intelligence Searches dashboard showing total searches (16,986), monthly search volume, high-intent search rate (48.5%), and a table of recent buyer search terms.
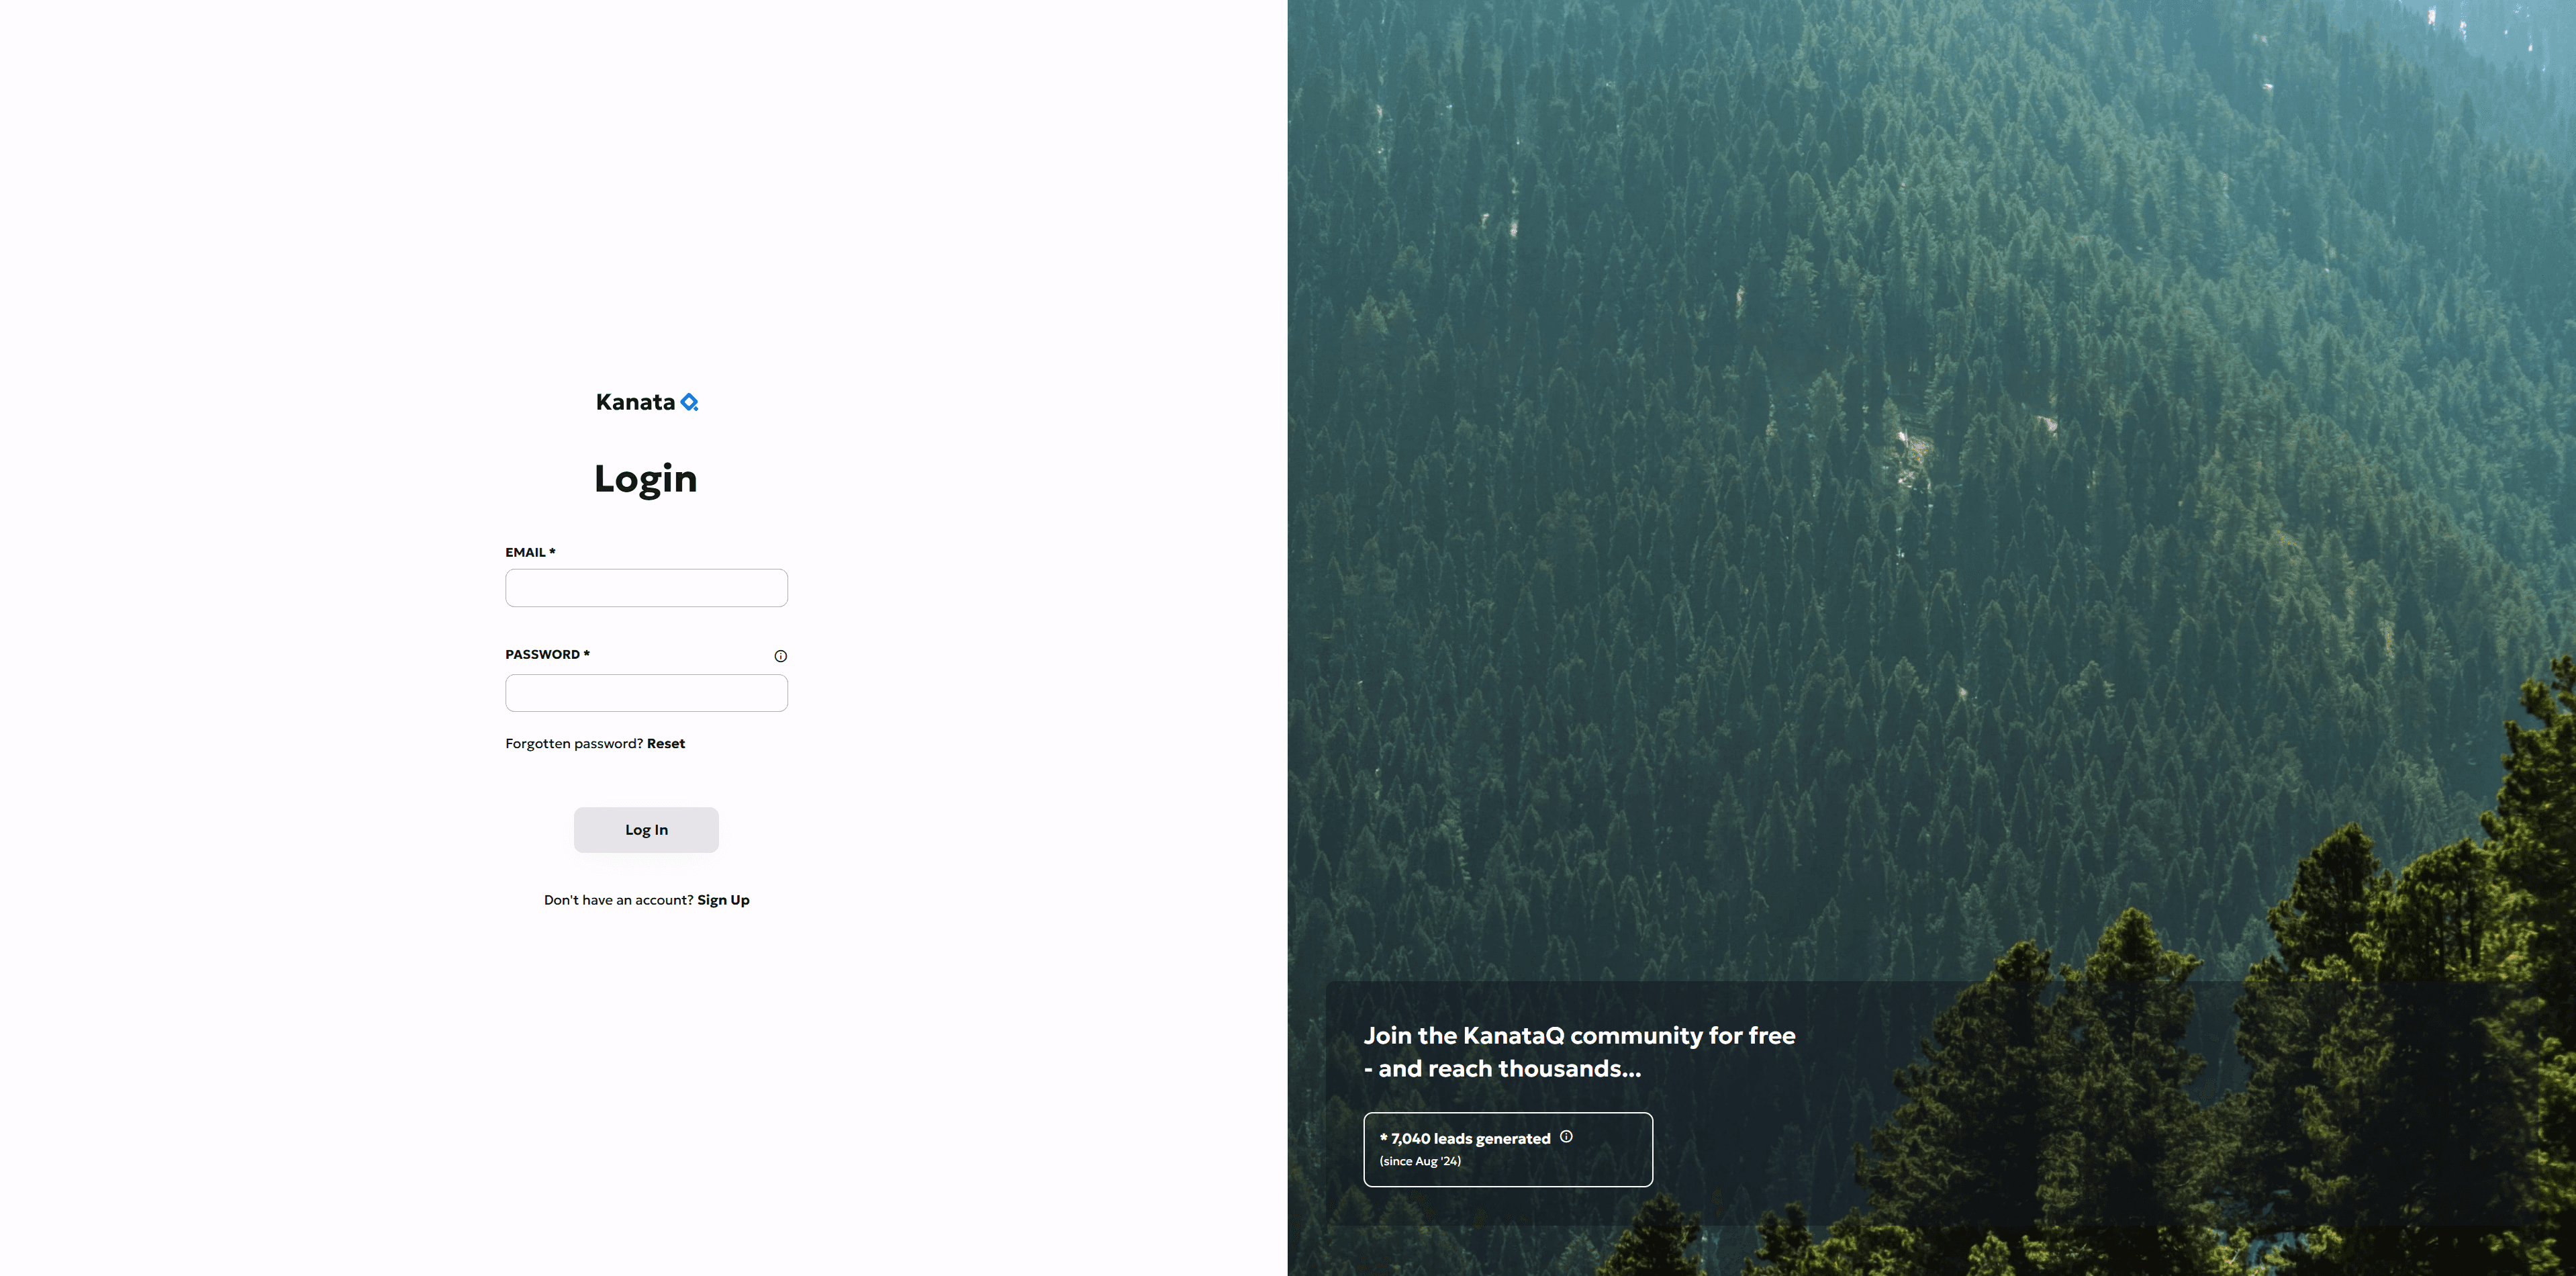
KanataQ login screen next to a forest image promoting free sign-up and '7,040 leads generated since Aug '24'."
KanataQ Contact page with a 'Book a Call' button, three contact options (Email, Help centre, Meet with us), and the start of an FAQ section.

Talk to our team

Share the markets, categories, or decisions you are exploring.

Get Intelligence access

Explore the data and benchmarks most relevant to your work.

Track demand and market movements

Follow buyer interest in real time and compare the wider market monthly.

Act with confidence

Use current evidence to sharpen your strategy and move earlier.

KanataQ Market Intelligence Profile Views dashboard with a line chart comparing average buyer views over time for All Solutions versus a Carbon Accounting segment, both trending upward.
KanataQ Market Intelligence Searches dashboard showing total searches (16,986), monthly search volume, high-intent search rate (48.5%), and a table of recent buyer search terms.
KanataQ login screen next to a forest image promoting free sign-up and '7,040 leads generated since Aug '24'."
KanataQ Contact page with a 'Book a Call' button, three contact options (Email, Help centre, Meet with us), and the start of an FAQ section.

Ready to get started?

Discover trusted sustainability solutions, or list your own - free to get started